Real Estate: A Time to Buy. A Time to Sell.

In April and May, housing prices in the US were at all-time highs. In some areas, they are higher than they were at the early 2007 peak, right before the real estate industry began melting down before collapsing in 2008.

Could we be in for a repeat of that?

As I’m sure you remember, when the real estate bubble burst, it sent the US economy (and the rest of the world) into what became known as The Great Recession. In less than three years, it wiped out trillions of dollars’ worth of wealth – mostly from working- and middle -class homebuyers. Thanks to the government bailout, a good deal of that money was transferred to the financial upper classes, through the conduit of Wall Street, bankers, brokers, and insurance companies.

Media pundits and Wall Street CEOs called the crash “unprecedented” and “unpredictable.” That was balderdash, Americans learned later, when books and movies about the collapse started hitting the bestseller and top-rated film lists.

I was heavily invested in real estate prior to 2006. I started pulling back in 2007, and was out entirely before the crash. My investments had been in rental houses and apartments, not in REITs or other real-estate dependent stocks. So, I wasn’t listening to CNN or reading the NYT to find out what was going on with real estate. I was looking at the local markets, and making my buy/sell decisions accordingly.

My goal back then was to make an 8% return on my investment, cash on cash, and at least 12% with leverage (a mortgage). When prices got so high that I couldn’t make those numbers, I stopped buying. It was as simple as that.

When my friends, colleagues, and Jiu Jitsu buddies that were gobbling up properties like syrup-slathered pancakes asked me why I had stopped buying, I explained it another way. I told them that I was bothered by the discrepancy between the average income of first-time homebuyers and the average cost of a starter home.

I had always heard that a healthy ratio of household income-to-house price was about 1:5 (20%). In other words, a family with an income of $50,000 should be able to buy a house priced at up to $250,000. But in 2007, the average startup houses where I was looking in South Florida were selling for $400,000 to $500,000. And the average income for first-time homebuyers was just $60,000 to $70,000.

The numbers didn’t work. Still, banks were giving mortgages to anyone and everyone that had a pulse. And then packaging that “sub-prime” paper in bundles and selling them to huge financial institutions. You know, the ones that the government later bailed out, leaving millions of middle- and working-class Americans with debt they could not possibly repay.

Today, housing prices in South Florida – and up and down the coasts – are as high (or higher) as they were back then. Household income has risen, but not as much. In terms of household income and starter-home prices, the ratio is just as bad as it was in 2007. There is a difference, however, that is important. Banks are not handing out mortgages as freely as they did back then.

What this means to me: I am not expecting another real estate collapse like the one we had 14 years ago. I’m expecting to see prices come down to a sustainable level, and, in fact, it’s already started to happen. With interest rates going up, I’m expecting them to come down a good deal more in the coming six to 18 months.

As a direct investor in real estate, that doesn’t worry me terribly. That’s because I haven’t been buying property for several years. (And won’t again till prices move into buying territory.) However, I am keeping my eye on rental rates in the areas where I own property. If those rates go down significantly, so will my future ROIs.

I’m also wondering what to do with the cash I’ve been collecting from selling off some of my properties – particularly office buildings in cities (like Baltimore) that are seeing corporate flight due to high taxes and rising crime.

I’ve been looking around in states like Texas and Nevada that are benefitting from the emigration out of California. There are some pockets of hope there. I’ve toyed with the idea of investing in REITs, but given the way the economy looks generally, and rising interest rates, I’m not sanguine about any real estate-related stocks.

More on this in an upcoming issue.

Meanwhile, here’s an interesting chart that shows the average home prices in various cities around the US and the average yearly income it would take to buy one at the 1:5 ratio. Click here.


The Ups and Downs of Airfare 

In the Aug. 2 issue,  I said that while inflation is likely to continue rising overall, there will likely be pockets of deflation among industries that are both competitive and cater to the working and middle classes. (Like starter real estate. See above.)

And although you wouldn’t know it if you’ve been flying lately (and experienced the crowded airports and constantly cancelled and delayed flights), domestic air travel in the US is lower than many expected this year. This may be due, at least in part, to the feeling most Americans have of being financially strapped. Click here.

The Latest Example of What We Can Look Forward To

Robinhood, the stock trading app that was so hot a year ago, announced that it is laying off around 23% of its workforce. This is its second significant layoff. The first was 9%. The layoffs will be primarily in operations, marketing, and program management. They blamed “deterioration of the macro environment, with inflation at 40-year highs accompanied by a broad crypto market crash.”

Why does that matter? As I said in Tuesday’s blog post, the financial advisory market has a history of shrinking months before recessions and subsequent market downturns. Robinhood is not in the financial information business, like we are, but it’s Fintech, which is close.

I see this as another indication of what’s to come. Click here.

If you lost money investing in Robinhood, you should have been reading the advice of my friend and colleague Charles Mizrahi, who pointed out the company’s weaknesses last year. In this short article, he explains why it was a bad “play” to begin with, click here. [LINK]


More Bad Economic News

US household debt increased by 2% to $16.2 trillion at the end of June. Given 123 million households, this means the average family debt grew by nearly $10,000 last year. That’s significant.

Also worrying: Debt delinquencies are up. The biggest factors are mortgages, auto-loans, and credit card balances. (Credit card balances jumped by 13%, the largest increase in more than 20 years.) Add to that the fact that the Fed has finally begun to raise rates, which will make repaying current debts more difficult.

What that means: The combination of higher household debt and higher interest rates on mortgages means that sensible people will be spending less on all discretionary expenditures, and senseless people will be quickly spending their way into bankruptcy. Both of these trends will make it more difficult for us to stop our currently shrinking GDP.


The Recession of 2022: How Bad and Long Will It Get

It’s official. The US is in a recession. According to a report issued last week by the Bureau of Economic Analysis, the real GDP (gross domestic product) decreased in the second quarter of the year by 0.9%. It decreased in the first quarter by 1.6%. (The Bureau of Economic Analysis, an agency of the US Department of Commerce, has been the government’s official tracker of GDP and other economic indicators since 1972.)

You can read the report here.

Biden officials and most of the mainstream economic experts, including Treasury Secretary Janet Yellen, have been telling us for six months that there wasn’t going to be a recession, and that the spike of inflation we saw earlier this year was only temporary. They were wrong. But they were also wrong about the Great Recession that followed the 2007/2008 real estate meltdown. And every other economic downturn, big and small, for the last 50 years.

This should not surprise you. High profile and highly paid economists, whether they work for the mainstream media, Wall Street, Big Tech, or big government, are essentially paid to ignore or deny bad economic news – to promote optimism and push federal spending, in hopes of pumping up the economy and thus keeping incumbents in office and encouraging business borrowing, consumer and business spending, and sales.

Right now, in a desperate attempt to keep the American working- and middle-classes from despairing our country’s economic future, they are denying the fact that we are in a recession by redefining the term.

Until now, economists agreed on a simple criterion. Two consecutive quarters of negative GDP growth = a recession. And that, as I said above, is what we have had this year. I won’t bother you with their argument. It’s laughably wrong. And it’s not fooling anybody – at least not anyone that has noticed the rising cost of milk, bread, dishwashers, cars, diapers, and gasoline. Or anyone that works in manufacturing, housing, or construction that has noticed that iron and steel and shingles and plywood are more expensive than they’ve ever been. They are fooling only the portion of the population that is too wealthy to be affected by these 10% to 30% price increases. Including the mainstream media pundits that repeat their talking points. (And also including RF, my brother-in-law, who has bet me that the recession will be over in a matter of months.)

I’m going with the Bureau of Economic Analysis’s 50-year-old definition of recession. And my prediction is that it will get worse, and stay worse, for at least the next few years.

One reason I feel that way is based on my personal experience in my current business. That business – publishing information and advice about investing – has traditionally been a bellwether of economic trends. Months before folks pull back on buying cars and TVs because of economic uncertainty, they pull back on buying investment advice. This has happened prior to every recession, big and small, since I’ve been in this business. That’s 40 years. And something like 16 quarterly downturns and a half dozen serious recessions.

About 18 months ago, we began to see a slowdown in our industry. Prospective customers and even existing customers were reluctant to buy more investment services. Since the beginning of the year, our sales are down by more than a third. That means cutbacks and layoffs and, most importantly, reduced spending on recruiting new readers and subscribers.

The principal talking point of those that are predicting a quick return to positive growth has been the unemployment statistics, which were at all-time lows a few months ago. You couldn’t find a restaurant or grocery store that didn’t have a help-wanted sign in their window. But if our industry is once again indicative of the future economy, we’ll be seeing unemployment surging in the next six to 12 months.

It will happen because of the “wage-price spiral” I mentioned in Saturday’s issue. The higher wages that companies are paying now will become more difficult to support as inflation ratchets up every other cost of business. That means thousands, maybe tens of thousands, of businesses, large and small, will be laying off employees and, in some cases, shutting down.

So, that’s what I’m going to be looking at in the coming months. In the meantime, I’m recommending significant cutbacks to the companies I own and/or consult with. Fewer products, simpler systems, and fewer (but better) employees.

I’m also making a few changes in my investment portfolio. (More on that in a coming issue.)


This Doesn’t Bode Well for My Brother-in-Law 

The Bureau of Economic Analysis’s bad news about the GDP (above) came a day after the Federal Reserve raised interest rates by 0.75 percentage points, the fourth raise this year. The goal, of course, is to try to stop any further inflation, which is, at 9.1%, at a 40-year high. (You can check out our annual inflation rate here.)

What does this mean? It means that it will cost businesses and consumers more to borrow more. There will be deflation in some areas of the economy – industries that sell optional products for middle- and working-class people. But inflation for everything else. And “everything else” is the lion’s share of the economy. That’s not good.


And It’s Not Just Here… 

I’ve been reporting on America’s economic troubles regularly. Inflation, runaway government spending, and the Cold War with Russia have significantly curtailed US GDP and made middle-class Americans poorer. But things are just as bad for China and Russia and most of our European allies. It’s no surprise, then, that the International Monetary Fund lowered its growth projections for the world economy to 3.2% for this year and going down to 2.9% next year.

Click here.


Need a Low Paying Job? Walmart Wants You!

Because of the particular nature of the economy today, the general rise in unemployment that I’m predicting is likely to hit hardest among the higher paying jobs. But if you are willing to work for minimum-wage (or thereabouts), there will be opportunities. Walmart, for example, is looking to hire. Click here.


What Is the “Wage-Price Spiral” – and Why Is It a Problem?

Prices are going up. And real incomes (nominal income minus inflation) are going down. (Wages up 5%; Inflation up 9%)

From Bonner Private Research:

“Workers will, of course, push employers for wage increases to keep up with inflation. But [thanks to years of Fed-induced malinvestment] productivity is sagging… so the only way employers can pay more is by passing along the costs to consumers – further pushing up prices. This is the ‘wage-price spiral’ that troubles central bankers’ sleep. Wages go up to keep the working stiffs from losing ground. Then, the extra labor costs force up prices. The higher prices cause workers to plead for higher wages. Wages tend to be ‘sticky,’ say economists. Once a raise is given, it is hard to take it away. So, wage-driven price increases ratchet upwards with no easy way to bring them down.”

Another Way That Inflation Is Slowing Growth

Walmart shares slid 10% after the company reduced its profit expectations as a result of changes in consumer spending habits. Shares of other big retailers, including Target and Amazon, also fell. Inflation, Walmart noted, is causing shoppers to spend more on necessities such as food and less on items like clothing and electronics. As a result, inventory of merchandise that customers don’t want is piling up, and retailers are being forced to aggressively mark it down. Click here

And Yet, Yacht Sales Are Booming

Discount retailers like Walmart are seeing the impact of inflation. The same is true with just about every business that sells commodity products to middle-class and working-class consumers. But the luxury market – or at least the upper end of it – exists in its own economic sphere.

For example, last year, 887 “super yachts” were purchased, twice as many as were sold in 2020, according to The New Yorker. Super yachts are just what they sound like. Super-sized (over 100 feet) and super-luxurious, costing upwards of $100 million. Why the jump in sales? The simplest reason is a growth in the number of  super-rich people. Since 1990, the number of US billionaires jumped from 66 to more than 700, while the median hourly wage increased only 20%. The number of gigayachts (yachts over 250 feet) jumped from under 10 to more than 170 during the same time

Are Psychedelics the Next Pot Stocks? 

Even in bear markets, there are businesses, and even industries, that experience growth. And that makes for opportunities for shrewd investors. One such industry that I’ve been following for several years lives in between the health and recreation industries. I’m speaking of psychedelics.

Since the beginning of decriminalization, the marijuana business has grown the US economy by about $20 billion. It looks like we are going through the same thing with psychedelic drugs. It’s early in legalizing them, but by some estimates the industry will be at about $5 billion in the next five years.

About the Future of America…

Once the Digital Dollar Is Put Into Circulation!

We’ve all been deluged recently with reports on the rise of inflation and the risk of an extended economic recession. And for the past year or so, I’ve been writing about the likelihood that the US will one day adopt a digital dollar and the possible repercussions of that.

I suspect that the economy will get worse before it gets better. And that this will accelerate the move to the digital dollar. The floundering (soon to be foundering) economy should not be a reason to rush towards a digital dollar, but it does provide rationales for pushing it forward by our elected officials that understand how it will increase their ability to have more control over the populace. And they come from both sides of the aisle.

Today, I want to try to accelerate your interest in this topic by giving you some scary but entirely possible outcomes if (when) this happens.

I’ll start with this: The digital dollar will be presented as a solution to three significant problems that – from the government’s perspective – are making it near impossible to balance the budget and build back America’s economy better:

  1. Institutional favoritism to big companies, including pork barrel legislation, federal regulation, and deregulation. (Remember, this will come from both Republicans and Democrats.)
  1. Wealth and income inequality.
  1. Tax avoidance and evasion by the one percent of the richest US companies and individuals.

My theory is that the digital dollar will not solve those problems. It will, instead, make them worse. And it could also result in the destruction of the values that made the US the world’s largest and strongest economy. Those values include free enterprise, individual liberty, entrepreneurship, states’ rights, financial privacy, personal privacy, and democracy itself.

Here is an admittedly sensational way to put it. But since I think it’s within the realm of possibility, and feeling less extreme and more likely the more I dig into it, I’m going to give it to you the way I presented it to a colleague that is producing a documentary about the danger.

I said:

This is the story of the digital dollar being used as a government tool to monitor and record every move its citizens make. Calling it a digital dollar, as if its purpose were a simplified substitute for the dollar, is a ruse. It will become a digital monitoring and control technology that will be connected to every other digital tool we use. It will be on the blockchain, so the activity will be permanently recorded and available, but only to the government. They will track, not just every purchase every person (citizen, non-citizen, visitor, etc.) makes, but every place they go, every publication they subscribe to, every cause they contribute to, every person they do business with, etc.

And it will be married, as the Chinese have already done, to a social reputation score that will determine our ability to purchase the products and services we want. No more things that are “bad” for us, including “unhealthy” foods; “dangerous” herbs and medicines; “subversive” books, magazines, and e-publications; access to “disreputable” chat rooms, clubs, and other social groups. Not to mention our ability to purchase firearms, sell our houses, rent second homes, travel, etc.

The technology will make tax avoidance extinct, as well as any sort of business activity that the government deems unwise or improper. And it will reward us by raising our personal social reputation score when we report on any questionable conduct by our family, friends, and neighbors. (Which most Chinese citizens say they enjoy doing!)

The transition to a digital dollar is already underway in this country. All the powers that be – big government, big tech, and mainstream media – are fully behind it. As will be the majority of Americans when the information campaign to support it reaches its peak.

And it is all going to happen in the next 10 years, if things don’t change.

So, there you have it. Is this madness? A delusion? The paranoid perspective of someone that’s been reading too much fake news? You will have to judge for yourself. In the meantime, when new facts emerge, I’ll tell you about them and how I think they fit into this movie.

Is the American Middle Class Shrinking? 

“The American middle class is shrinking!”

So said the headline. And it sounded right to me. Over the past 20 years, our elected officials and the Federal Reserve have done so many whacky things, trying to regulate the economy, that I have been expecting all sorts of bad economic news like this. “Well, I’ll write about it on Tuesday,” I decided. “I’ll explain how this unhappy fact supports my general theory of economics.”

Hmm….

But I don’t have a general theory exactly. I know a handful of facts. I’ve read the big names. And I have some commonsense notions based on experience. But a general theory? No.

Plus, I realized that I don’t know what “middle class” means. I mean, I understand that a middle-class family is neither rich nor poor. But surely there is a more precise way to define it!

I did some reading. It turns out there are several commonly used definitions. Pew Research Center, perhaps the most often-cited authority, classifies income of between $30,000 and $90,000 as middle class. For a family of two, the range is $42,000 to $127,000. For a family of three, $52,000 to $156,000.

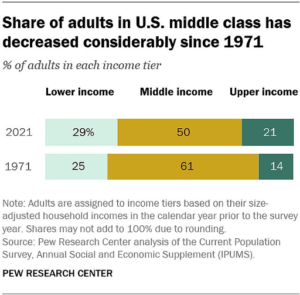
Based on that, about 52% of Americans are middle class, with 29% earning less and 19% earning more.

That seems reasonable. About 50% in the middle and the rest above or below it.

But what about this recent headline about the middle class getting smaller? As you can see from the chart below, it’s true. In 1970, 61% of Americans earned enough income to be categorized as middle class. Today, that number is down by nearly 11%.

Who got poorer? And who got richer? In 1970, 25% of Americans and American families earned less than the bottom of the middle-class range, while 14% earned more than the top of the range. Today, the percentage of the population that is in the lower third has increased from 25% in 1971 to 29% in 2021. And the percentage that is in the upper third has grown from 14% to 21%.

So, 7% of the population got richer. And 4% got poorer. Thus accounting for the 11% differential.

What happened? And why didn’t we notice? 

At one level, the answer to the first question is easy. Over that 50-year span, the cost of living increased a bit more each year than did the rise in average wages.

Some of that was due to a gradually aging population. (A higher percentage of retirees.) Some of it was due to two recessions, and particularly the post-2008 Great Recession. But except for a few noisy cranks, the biggest factor was pretty much ignored. And that was the fact that since that time our government has been quietly but steadily spending more money than it was collecting in taxes.

In 1971, President Nixon took the US dollar off the gold standard. What that meant, in the simplest terms, was that our elected officials could spend pretty much however much money they wanted to spend because they could balance the books by selling US treasury bonds. So long as there were buyers for US debt, they could continue to fund their save-the-world ideas, including the war against poverty, the war against drugs, and all the proxy wars we’ve been fighting since then, which I talked about in the March 11 issue.

In response to the threat of an economic crash after the real estate bubble burst in 2007 and 2008, Obama and then Trump and now Biden, supported by the House and the Senate, have accelerated the national debt. That not only made the US dollar more fragile, but also encouraged consumer debt, which rose alongside US debt.

Today, US debt stands at more than $30 trillion. And consumer debt at nearly $16 trillion.

To make matters worse, we have record-high inflation. US inflation rose 9.1% year-over-year in June, up from the 40-year high of 8.6% in May and the largest 12-month increase since November 1981. Rising costs of shelter, gas, and food were among the primary contributors  to the increase. Energy prices rose 7.5% in June, with gas prices up 11.2% from May. You can see the data release here.

So that’s where we find ourselves now. And the picture we face – with the economy moving into another recession – doesn’t look good. More on this next week.

For now, if you’d like to read more on this depressing subject, click here and here.


A Ray of Hope or an Illusion?

Not everyone thinks the US economy is in trouble. President Joe Biden said the most recent jobs report (July 8) showed “significant progress” towards economic health. He didn’t mention how the recovery in the employment rate was almost entirely a phenomenon of conservative red states, beating out liberal blue states in jobs growth by a considerable margin.

According to an analysis by the Labor Department, red states added 341,000 jobs since February 2020, while blue states lost 1.3 million jobs through May. “The states that gained the most, led by Florida, Texas, and North Carolina, are almost all red,” The Wall Street Journal noted. “The states that lost the most jobs are almost all blue, led by California, New York, and Illinois.”