My First State of the Economy Report: January 2025
I try to limit the reading I do on the state of the economy to no more than 30 minutes per day. Not because I don’t hold economic theory in high regard. I do. But I’ve only a rudimentary understanding of economic theory and the metrics of economic analysis. And, at age 74, I’m not going to spend a big part of my days trying to catch up. What I do instead is the same thing I do in terms of investment theory and advice. Read just enough to understand what’s at stake. Put questions to experts (friends and colleagues) when I have them. And then do my best to hedge my bets.
For this issue, being the first of 2025, I’ve been trying to figure out what’s at stake for investors in the next 12 months and in the longer term.
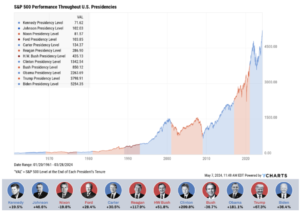
Based on the reading I’ve done, I feel optimistic about most of my financial investments (stocks, bonds, cash instruments) in the short term. And that’s primarily because of the optimism I see among all the people I know in the banking and investment industry over Trump’s victory. I see that propping up the stock market and several other asset classes (high-end art and collectibles, certain debt instruments, and segments of the cryptocurrency market) throughout 2025. But after that… Well, continue reading and you’ll see.
Consumer Holiday Spending: What Does It Tell Us?
Spending over the holidays fell in line with voting in November.
Americans spent about 4% more from 11/1 through 12/24 than they did during the same period last year, according to a Mastercard survey.
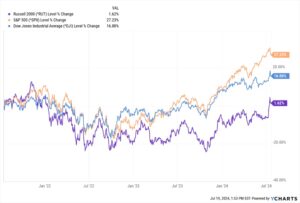
But the spending mirrored the results of the election, with high income ($100,000+) shoppers, fat on a 25% boost in their stock portfolios, spending considerably more than they did last year, while the rest of the country, pinched by stagnant wages and higher costs, spent less.
According to a report in the WSJ:
“Retailers noticed the difference. Williams-Sonoma, the upscale kitchen and furniture retailer, posted strong quarterly sales and said in late November it was having success moving away from promotional fluctuations. Meanwhile, discounters Dollar Tree and Dollar General said in early December that they were suffering from belt-tightening among their core consumers.”
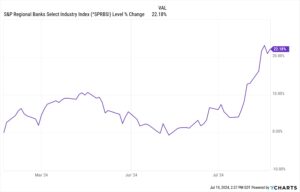
This supports my optimism. Stocks and other asset classes favored by high-net-worth and high-income investors will stay strong. However, I don’t feel that way about investments in manufacturers and vendors of relatively expensive things to middle- and lower-income workers (e.g., housing and cars). Nor do I feel good about chain restaurants and large retail chains.
The Not-So-Good Numbers on Jobs

In the Dec. 27 issue of “Just One Thing,” I wrote about how the Biden administration was touting some positive economic indicators, such as job openings, as an example of Bidenomics. I said that most of those metrics related to the recovery from the COVID shutdown, not to anything that the Biden administration did during his tenure.
This was confirmed by recently published government data that showed that job openings had dropped 33% from 12 million in the first half of 2024 to less than 8 million in the second half of the year. There were an estimated 7.4 million unfilled jobs on the last day of September, a drop from August’s revised tally of 7.86 million openings, according to new data released by the Bureau of Labor Statistics. The largest drop-offs in openings were in industries that have driven much of the job growth in recent years: healthcare and social assistance and government, according to the report.
This doesn’t bode well for the industries I mentioned above.
Meanwhile, major employers continue to shed workers all over the nation.
For example, the US lost 46,000 manufacturing jobs in October, bringing the total loss to 78,000 during the third quarter of the year.
“Once we get past the holiday season,” one commentator I follow said recently, “retailers are going to be dropping like flies.”
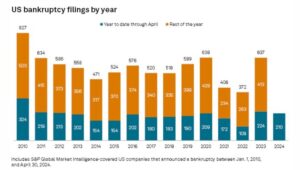
This feels to me like a genuine possibility. For example, Party City, a craft retailer with 850 stores across the nation, is considering filing for bankruptcy, after the company surfaced from Chapter 11 bankruptcy.
Also in the news: 670 Family Dollar stores have been shut down.
And this comes after tens of thousands of retail stores in the US have been shuttered in 2024.
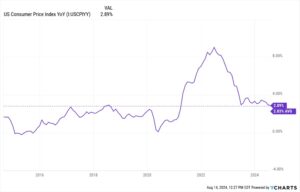
And as anyone following the US economy knows, inflation has continued to eat away at the dollar’s spending power. One recent survey found that about a third of all US households have been forced to cut back spending just to make ends meet.
Most Americans Are Feeling the Pinch
A recent Lending Tree study that analyzed US Census Bureau Household Pulse Survey data from Aug. 20, 2024 to Sep. 16, 2024 found that more than 34% of respondents said they had to cut back or skip spending on certain necessary expenses at least once over the past year in order to pay their energy bills.
However, my prediction is that none of this will have a significant short-term effect on the stock market and the other assets favored by high-net-worth and high-income consumers. In other words, I’m not anticipating seeing the market crash any time soon. But “soon” for me means 6 to 12 months.
Based on the reading I’ve done on the US economy as a whole, I am anticipating a major correction of some kind during Trump’s second term. And that’s because the macro-economic facts are so bad.
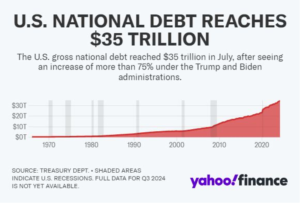
Here’s What Really Concerns Me…The Incredible Size of US Debt
There is no doubt about it in my mind. The biggest threat to the future of the US economy is US federal debt. As I write this, it is $36 trillion and counting.
To give you a sense of how big that is, consider this: Non-defense outlays were barely 5% of GDP until after WWII. Now they are around 20%.
And as David Stockman points out: “That’s just the annual charge. Regulation and debt are cumulative. And they’ve been building up for decades. They now cause so much delay and useless expense that much of Americans’ output is squandered… or never produced at all.”
And get this: The interest payments that our government must pay on that debt is more than $1 trillion a year!
That trillion dollars is about 4% of our entire economy’s entire economic output.
And remember, debt payments are not for future projects but for programs already enacted years and in some cases decades ago.
If that isn’t bad enough, the National Association of Manufacturers estimates that federal government regulations are costing US taxpayers an additional $3 trillion per year.
“Between the two,” Stockman says, “that’s about 15% of America’s entire GDP.”
No wonder most people have made very little real economic progress in the last half a century.
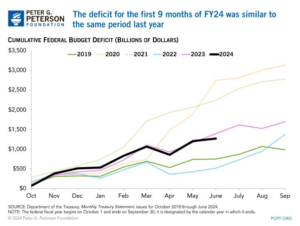
Government Overspending Continues
As you probably know, the Senate voted 76-20 a week ago to pass what is called the Social Security Fairness Act. It was promoted as a measure that would bring the retirement benefits for public employees to the same level as private employees receive.
In fact, according to the WSJ, it was a package of extra bonuses and benefits – so much so that Senate majority leader Chuck Schumer called it a “well-deserved Christmas gift.”
“This is political flim-flam,” a WSJ opinion piece stated. “Retirement benefits for government employees are at least comparable to similarly paid private workers, and they are often much more generous for those who meet requirements for a defined-benefit pension.”
In fact, the bill reversed reforms passed in the 1980s to rescue Social Security that kept public employees in step with everyone else under Social Security’s benefit formula. It will cost taxpayers an estimated $196 billion over 10 years.
Mandatory social benefit programs like Social Security consume more than 70% of the federal budget. The bill would add additional billions in costs.
Meanwhile, Social Security is already running a $4 trillion 10-year deficit, and it’s on pace for an automatic 21% benefit cut by 2033.
This is not a Democrat/Republican issue. The GOP-led House passed the changes, 327-75, with Republicans in favor by nearly two to one. And 27 GOP senators voted in favor.
Can Anyone Fix a Problem This Big?

Trump has recruited Elon Musk and Vivek Ramaswamy to head up a team to drastically slash federal spending and eventually put the US fiscal and monetary system back on solid ground.
But that’s an enormous job. Some would say impossible. I’d like to believe the dynamic duo can make it happen. But based on what Congress just did, I’m not sanguine.
P.S. As I said above, Trump is in position to fix a lot of things that are broken right now in America. The fixes won’t be easy, but with the right expertise to carry out his plans along with a Congress and media that is open to improvements, we could be looking at four years of extraordinary reform and progress in many sectors. But of all the challenges Trump and his administration will face, none is greater than US federal debt. Here are two pieces by David Stockman that spell out the enormous problem of the US’s $36 trillion in debt.
Part I: The Mother of All Debt Crisis
Part II: The Fiscal Jig is Up