
Chart of the Week: More Pain Inbound?
As Sean mentions this week, I’d been concerned that the stock market was cruising for a bruising for some time now. Between our government’s $34 trillion debt problem, the serious problems in the retail industry, the crazy price inflation in some real estate markets, and the threat of nuclear war, I thought, “How long can this last?”
Well, it didn’t last. I’m sure you’ve been reading about the Japanese “carry trade problem” and how it eventually triggered the recent stock market drop. So, the question I have for Sean, and the one he addresses here, is: What now? How should we feel about the state of the US economy and the future of the US stock market? And what, if anything, we should do about it? – MF
Mark Ford asked me, two months ago, why the market seemed to keep going up.
I do not think anyone is asking why the market keeps going up anymore. Now, I think, people have the level of caution and concern they should have possessed months ago.
On Monday, Aug. 5, the Japanese “carry trade” began to unwind at the same time markets were processing a slew of negative economic data about the US economy.
We do not have the space here to explain the carry trade or its implications on your retirement fund. Nor would you be able to make it through the first two pages of necessary context before you fell asleep.
So in the meantime, we have to ask ourselves a simpler question: Is the market bloodbath over? Or just beginning?
We can look at historical trends for some clues:
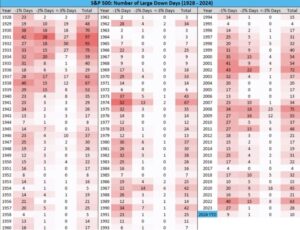
The table above shows the number of “significantly down” days we’ve seen in the market each year since 1928. As you can see, 2024 is the third-least-volatile year in the last 30 years, with only 10 of these drops.
So far, 2024 is an anomalously good year for stocks.
You may also notice that, going back to 1970, the market cycles between these extremes.
Low-volatility years are almost inevitably followed by higher-volatility years. And vice versa.
There’s a fairly simple investing takeaway from this.
When the market has been performing hilariously badly, and it seems that the blood will not stop flowing (like in 2022, 2020, 2011, 2009, 2008, 2002, and so on)…
Put aside money to buy more stocks.
Investors with patience understand what study after study has shown: There is a nearly inverse relationship between the realized return of stocks and their expected returns.
When stocks dip? Their future returns tend to spike. When stocks soar? Their future returns become middling.
And because stocks have soared, I expect a little bit more volatility ahead in the near term.
– Sean MacIntyre