 MarkFord
Chart of the Week: When to Buy Stocks
One thing any experienced salesperson knows is that, despite what we like to think, people make the decision to buy things based on their emotions rather than their reason. And that is true with buying stocks. The reason individual investors, on average and over the long term, earn less than one-third of the average stock market investor, it is because they are motivated to buy from greed and sell from fear. This week’s chart, as Sean explains, gives you a vivid way of understanding that and how it relates to the investing strategy we use. – MF
It’s often said that the stock market is not the economy, and the economy is not the stock market.
Scholarship backs this up. A study titled “Is Economic Growth Good for Investors?” found that, across countries and stock markets, GDP growth is bad for long-term stock returns. Conversely, GDP declines are typically followed by very good periods for stocks.
But I learned this years ago when I started asking myself a simple question: What economic conditions are best for purchasing stocks?
There’s one chart that taught me more about the relationship between economics and stock returns than any other… and it’s not one you’d expect.
I’m talking about the chart of rolling 20-year stock market returns.
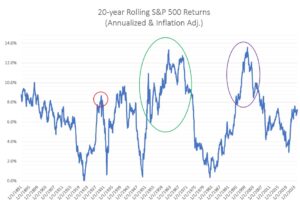
This chart shows how the S&P 500 performed over previous 20-year periods. For example, in the early 1960s, it shows how, for the previous 20 years, the return of the market was as high as 15% per year on average.
If you want to know what economic conditions lead to high stock returns, just pull up this chart, find the spikes in returns, and then ask yourself: “What happened 20 years before those spikes?”
For example, take a look at the spike in 1928 and 1929 (the red circle on the chart). Why were returns so good for the 20 years leading up to that one?
If you look back, what you see is that the US economy was doing terribly!
The US moved in and out of five recessions between 1899 and 1911. There was a recession before AND after World War I.
So what should you have done during those times when business activity and trade dropped by double digits?
Buy stocks.
Let’s take a look at the mid-1950s and 1960s (the green oval on the chart), when average stock market returns reached nearly 14% per year.
What happened 20 years before that?
The Great Depression. World War II. Some of the biggest stock market collapses in history.
So what should you have done when the world was falling apart?
Buy stocks.
Or how about the 1990s (the purple oval on the chart), when stock market returns reached unprecedented heights?
Go 20 years before that, when the US was crippled by stagflation, supply shortages led to lines at gas stations, the economy rolled in and out of recessions, and interest rates reached as high as 20%!
Guess what asset would have made you wealthier than any other while all of that was happening?
Stocks.
Baron Rothschild, the 18th century banker, famously said, “Buy when there’s blood in the streets, even if the blood is your own.”
I have only one problem with that advice: Nobody ever wants to actually follow it. In the moment, they get too scared.
Business is cyclical. So are investment patterns. And the best time to get in is usually at the bottom. Not the top.
So here’s what I want you to do.
The next time you read a report about all the coming economic catastrophes…
The next time you see evidence of an impending recession, or a “dead decade” in the stock market, or an epic market crash…
I want you to say, “Great. I can’t wait to buy more stocks when that finally happens.”
Because that’s the mindset that Mark has adopted with his Legacy Portfolio of stocks – a mindset that will allow you to actually profit from the inevitable up-and-down cycles of the economy and the stock market.
– Sean MacIntyre
Check out Sean’s YouTube channel here.