

Once Again, the Idea of a Wealth Tax Surfaces
In the new global/socialist age, the desire to tax and redistribute income and wealth is greater than ever. And the good people of the UN and G-20 are doing everything they can to reduce the gap between the very rich and everyone else.
The latest brainstorm arrives in a proposal by four countries in the G-20 to impose a 2% wealth tax on the world’s billionaires. And don’t think this couldn’t happen.
“The tax could be designed as a minimum levy equivalent to 2% of the wealth of the super-rich,” write economic ministers of Germany, Spain, Brazil, and South Africa in The Guardian. They say the levy would raise about $250 billion a year from some 3,000 billionaires and “would boost social justice and increase trust in the effectiveness of fiscal redistribution.”
They plan to float this at the next G-20 meeting in June.
As you might expect, it would principally be a tax raid on Americans (the most numerous billionaires). It would also be taxation without representation – a body of global elites attempting to impose a tax on Americans without it being passed by Congress.
Chart of the Week: Sell in May and Go Away?
Today, Sean gives us several graphs that depict one of the core insights of the Legacy Portfolio, which I developed with Sean and a small team of very smart analysts years ago. It’s proven itself over those years, and we’ve even made some tweaks to it that have boosted the returns a point or two. But the core strategy underpins the faith I have in the portfolio matching or exceeding historical returns in the future. – MF
There’s an old adage among experienced stock investors: “Sell in May and go away.”
The “sell in May” saying supposedly originated in England, centuries ago. Merchants and bankers in London’s financial district noticed that investment returns generally did worse in the summer.
That is to say, the most profitable business months of the year occurred when aristocrats were in London doing business and not spending their summer trying to escape the heat.
In fact, the original saying went “Sell in May and go away, and come back on St. Leger’s Day” (a holiday in mid-September).
In America, it has essentially come to refer to the period between Memorial Day and Labor Day, the first Monday of September.
The historical pattern was further popularized by the Stock Trader’s Almanac, which found investing in stocks as represented by the Dow Jones Industriaal Average from November to April and switching into bonds the other six months would have “produced reliable returns with reduced risk since 1950.”
And in all honesty, when you look at the Stock Trader’s Almanac data, it looks impressive at first:
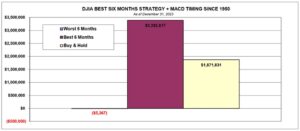
Following this strategy, with an added technical indicator called a “MACD crossover” (which is too complicated to explain at the moment), certainly produced exceptional results.
In fact, you’d have made over $3 million compared to the $1.8 million just buying and holding stocks – my preferred strategy most of the time.
That is, you would have made this money if you followed this strategy… for 73 years.
But I want to point something out that should be obvious:
The stock market in 2024 is not the same as the stock market in 1950.
We have computerized market makers now. And publicly traded derivatives. And passive index funds that definitely do not ever “sell in May.”
The market no longer depends on rich Lords being in London. There is, therefore, no logical reason why this strategy should be superior in the modern era.
To prove this, I looked at the data published by the Stock Trader’s Almanac.
Specifically, I looked at their S&P 500 results since 2002 based on the three portfolios they’re tracking: Sell in May, Buy in May, and Buy and Hold.
Let’s test this by investing $10,000 into each strategy in 2002.
Here are the results:
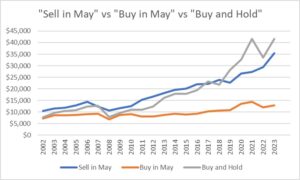
Both “Buy and Hold” and “Buy in May” had a rough start, due to the dot-com bubble collapse. “Sell in May” avoided that catastrophe.
But in most of the subsequent years, “Sell in May” actually underperformed – 2022 being a notable exception. “Buy and Hold” caught up and then surpassed “Sell in May” in 2019.
And even though we’re still waiting on 2024’s data, it still seems that “Buy and Hold” is dominating.
Over the last 10 years, the average return for “Sell in May” was 7.3%. But the average return for “Buy and Hold” was 12.7%. (“Buy in May” was 4.7%.)
In recent years, “Buy in May” has actually been outperforming “Sell in May.” In fact, during the recovery from the Corona Crash in 2020, “Buy in May” beat both “Buy and Hold” and “Sell in May.”
Long story short: “sell in May and go away” can help smooth out the growth of your portfolio, it seems, but it doesn’t beat simply buying and holding a basket of large, safe companies and weathering the slings and arrows of the market.
Especially when you consider how little time or effort you need to put in to make that strategy work.
But also, the stock market, more than most human endeavors, obeys Sturgeon’s Law: “Nothing is ever absolutely so.”
A strategy that outperforms for a decade can suddenly underperform for a decade, based on unpredictable shifts in demography, economics, or market dynamics.
Do not seek to find the best investment strategy. It doesn’t exist. Find, instead, the best strategy for you, your goals, and your temperament.
For me, that has almost always been “Buy and Hold.”
And I imagine that most of you will discover the same thing.
– Sean MacIntyre
Check out Sean’s YouTube channel here.